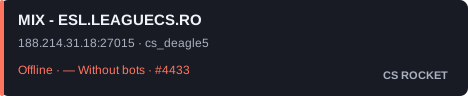
Recorded coverage: 20.5% · 30 days. Availability describes recorded checks, not gaps in monitoring.
Score is estimated player-hours over 30 days. More verified activity earns a higher position. Missing or suspicious observations and reported bots add no points.
Server online
Player counts over time
Average online
—
Peak online
—
Online history is collecting
The graph appears as new player data arrives.
08.11.2026 23:08 — 09.11.2026 23:08 UTCBots — dashed line
Gaps mean no data. Counts are reported by the game server.
Average online
0.2
Peak online
4
32241680
02.1104.1106.1108.1109.11
02.11.2026 23:08 — 09.11.2026 23:08 UTCBots — dashed line
Gaps mean no data. Counts are reported by the game server.
Average online
0.2
Peak online
4
32241680
10.1018.1025.1002.1109.11
10.10.2026 23:08 — 09.11.2026 23:08 UTCBots — dashed line
Gaps mean no data. Counts are reported by the game server.
Average online
0.2
Peak online
4
32241680
11.0803.0925.0918.1009.11
11.08.2026 23:08 — 09.11.2026 23:08 UTCDaily averages and recorded peaksBots — dashed line
Gaps mean no data. Counts are reported by the game server.
Share of the recorded map history. Average excludes reported bots.
Ranking movement
Global position · 30 days
↓ 4 24 hours
#2678#3121#3564#4007#4450
10.1018.1025.1002.1109.11
Higher means a better position. The 90-day view uses daily closing positions; shorter views use hourly observations. Markers show changes between observations; the badge compares with 24 hours ago. Gaps are not filled.
When to play
Patterns from the last 30 days, without reported bots
Peak hour
19:00–20:00
Active, with room to join
—
Hours observed
142 / 720
000.0
010.0
020.0
030.0
040.0
050.0
060.0
070.0
080.2
090.3
100.2
110.4
120.3
130.3
140.3
150.0
160.0
170.3
180.5
190.7
200.1
210.5
220.2
230.0
At least 3 different days are needed for each hour. Best hours have an active crowd and average occupancy below 85%. These are observed patterns, not a guarantee of available places. UTC.

 de_dust212% · Average online 0.1
 0Without bots
 Mix / competitive · de_inferno ·