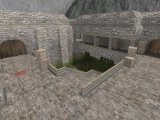
Next map: de_airstrip
cs da gestpar - free @ fshost.me
connect 5.161.230.85:10305- Players without bots
- —+ 0 bots
- Available places
- —
- Players connected
- 7 / 14
Server ranking
How it works- Global position
- #4409
- Player-hours · 30d
- 12.40
- Observed availability · 7d
- 21.4%
Online integrity: No anomalies detected.
Recorded coverage: 4.1% · 30 days. Availability describes recorded checks, not gaps in monitoring.
Score is estimated player-hours over 30 days. More verified activity earns a higher position. Missing or suspicious observations and reported bots add no points.
Server online
Player counts over time
Online history is collecting
The graph appears as new player data arrives.
Gaps mean no data. Counts are reported by the game server.
Gaps mean no data. Counts are reported by the game server.
Gaps mean no data. Counts are reported by the game server.
Gaps mean no data. Counts are reported by the game server.
Maps played
7 days
Share of the recorded map history. Average excludes reported bots.
Ranking movement
Global position · 30 days
Higher means a better position. The 90-day view uses daily closing positions; shorter views use hourly observations. Markers show changes between observations; the badge compares with 24 hours ago. Gaps are not filled.
When to play
Patterns from the last 30 days, without reported bots
- Peak hour
- —
- Active, with room to join
- —
- Hours observed
- 6 / 720
At least 3 different days are needed for each hour. Best hours have an active crowd and average occupancy below 85%. These are observed patterns, not a guarantee of available places. UTC.
Similar servers
Browse servers →Matched by categories, map, country and tags.
- #1 [TGR] tigUEres DEL Cs 1.6 | RANK.TIGUERESCS.COM32Without bots
 Classic / Public · de_aztec ·
23.26.135.135:27015 - 0Without bots
- 0Without bots
- 0Without bots
- 13Without bots
- 13Without bots
 Classic / Public · de_aztec ·
 Classic / Public · de_aztec ·
 Classic / Public · de_aztec ·
 Classic / Public · de_aztec ·
Players on the server
7| Nickname | Score | Time played |
|---|---|---|
| Tio Marcio | 25 | 00:34:20 |
| empty | 16 | 00:33:50 |
| (1)empty | 0 | 00:00:20 |
| Tio Estevam | 23 | 00:33:50 |
| VagnerPitEBou | 8 | 00:33:42 |
| Tio Edson | 19 | 00:29:19 |
| TERROR DA TECNICA | 14 | 00:28:15 |
The server supplies this list; it may include bots.
Banners and widgets
HTMLAdd live server status to your website. No account or API key is needed.
Image banner · 468 × 96
Live widget
The widget refreshes every 2 minutes. Banner images refresh when the host page reloads, with a 60-second cache. Offline and stale data are labelled.
Comments 0
- No comments yet. Be the first to share your experience.